Tower Ops Per CPC 2023

EightTwoSierra

Active Member
FAA
Messages
38
Facility
CNO Chino Tower
I know this was brought up in another thread regarding ARTCC and approach controls, but what was your tower’s operations per CPC in year 2023? I work at CNO and we have been begging for a higher target number for years. Just curious if any tower in the country ran more ops per controller than us last year.
 

Attachments

  • IMG_3810.jpeg
    IMG_3810.jpeg
    85.6 KB · Views: 502
Mid level tower onlys always get the shaft that’s why you have to move up. When you are Ground/Clearance calling the center for reroutes/FlightData/CIC/Metering like position/acting and coordinating as a TMC/ and on the phone with command center for EDCTS or the DEN for a VIP movement you realize how severely underpaid you are. At the high level towers everyone has their role to play
 
Just curious, what numbers are you using? I’m at MYF and our official operations count for the year was over 330k. I got here in July and we have 15 CPCs now but they spent half the year with mostly 11.
 
Just curious, what numbers are you using? I’m at MYF and our official operations count for the year was over 330k. I got here in July and we have 15 CPCs now but they spent half the year with mostly 11.
Just off pure CPC numbers at the end of the year. I know that’s flawed because every tower has a story. I used 9 CPCs for CNO, however we have had 2 certify through the year and one is medically DQ-d as of last year. So while numbers aren’t perfect it’s the best I could do to keep it fair.

Mid level tower onlys always get the shaft that’s why you have to move up. When you are Ground/Clearance calling the center for reroutes/FlightData/CIC/Metering like position/acting and coordinating as a TMC/ and on the phone with command center for EDCTS or the DEN for a VIP movement you realize how severely underpaid you are. At the high level towers everyone has their role to play
Can’t really move up easily out of here. Guys have had paperwork in since 2017 when I got here (including me) and are still stuck!
 
IWA had 260k ops and maybe 7 controllers average throughout the year. Hard to say controller wise I know they started the year with 4 I don’t know what they are at now.
 
FFZ had 317,238 operations in 2023 per ATADS, and 7 working CPCs for most of the year (9 CPCs January-May). That’s 45,319 for 7 CPCs / 35,248 for 9 CPCs.
Pretty bad the faa is so ass backwards a decently sought after facility like FFZ has staffing problems. I know about 5 people myself included that would love to be there too lol.
 
FFZ had 317,238 operations in 2023 per ATADS, and 7 working CPCs for most of the year (9 CPCs January-May). That’s 45,319 for 7 CPCs / 35,248 for 9 CPCs.
Dang!!! Yeah my numbers are off too since we had 7 at some points and 8 at other times. We technically have 9 but have a medical DQ.. Nice job over there
 
If only there was some kind of incentive pay the union could negotiate the Agency to pay when facilities are understaffed…
Also, if only the Union could negotiate some type of pay when controllers are working above a certain threshold each compared to other comparable facility types…
Man, that would be the starts of a great Union!
 
Dude making this argument saying he worked both tower/enroute and knows how tower is busier washed on the D side. Just saying.
 
I know this was brought up in another thread regarding ARTCC and approach controls, but what was your tower’s operations per CPC in year 2023? I work at CNO and we have been begging for a higher target number for years. Just curious if any tower in the country ran more ops per controller than us last year.
We did 124k between 5 controllers at an fct. So, right about the same
 
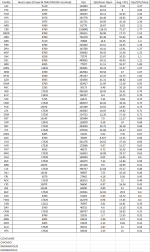
I think one of the things not taken into account is the hours a facility is open because a 24/7 facility with 100k ops is half as busy as a facility open 12 hours a day with 100k ops given they have the same number of CPCs.

tldr; the higher the number in the final column, the more ops every CPC did per hour their facility was open, the lower the number the number the less ops every CPC did per hour their facility was open

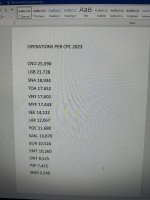
This is borderline autistic but stay with me. I took all the facilities in the Cleveland, Chicago, Indianapolis, and Minneapolis districts (basically the entire Great Lakes region) and determined how many hours they were open for the year. I even took into account some oddball facilities that have different hours for different months or days of the week so it should be fairly accurate. If a facility was an up/down, I doubled the hours open so it would be on par with the tower only/TRACON only facilities (if you don’t think that’s fair then just ignore the up/downs). I then divided the total number of operations by the number of hours open to get the average number of ops per hours open (a more accurate representation of how busy a facility is than ops/year). I went through the priority placement tool for each month of 2023 and took the average off all the months for each facility for a more accurate representation of average CPCs for the entire year. I then took the ops/hour open number and divided it by the average CPC number to get a final number showing the average ops per hour open per CPC.

This doesn’t take account for 114s, parental leave, or any other things that hurt your staffing but don’t show up on the PPT.
 

Attachments

  • image.png
    image.png
    117.5 KB · Views: 154
This seems like a very “gee whizz” argument and I struggle to see the relevance or purpose.

The amount of ops doesn’t paint a true picture of who works “harder” and even that is objective.

And ORD tower controller says “ cleared for takeoff” 1000 times a day vs a PTK controller who says “cleared for the option” to the same C172 20 times in an hour. Most of the high ops facilities are high volume, low complexity. Complexity is what separates the difficult sectors/facilities/areas from the rest.

I just don’t get what point we are trying to make.
At least where I’m at, it’s not “cleared for the option” all day. It’s very very busy sequencing aircraft all day long with wildly different speeds, pilot skill levels, etc. I personally made the case at CNO because we are far and away #1 in ops per controller in the Southern California region. Our target number is less than a level 5 tower like SMO, but we work 5 times the traffic. Nothing ever gets done about it. That’s the main reason for bringing it up, maybe some metric could be put in place to help places heavily understaffed.. Use this formula to see which places are well outside the norm to target more staffing.
 
Back
Top Bottom